Employment Outcomes
The McCourt School of Public Policy prepares future policy leaders.
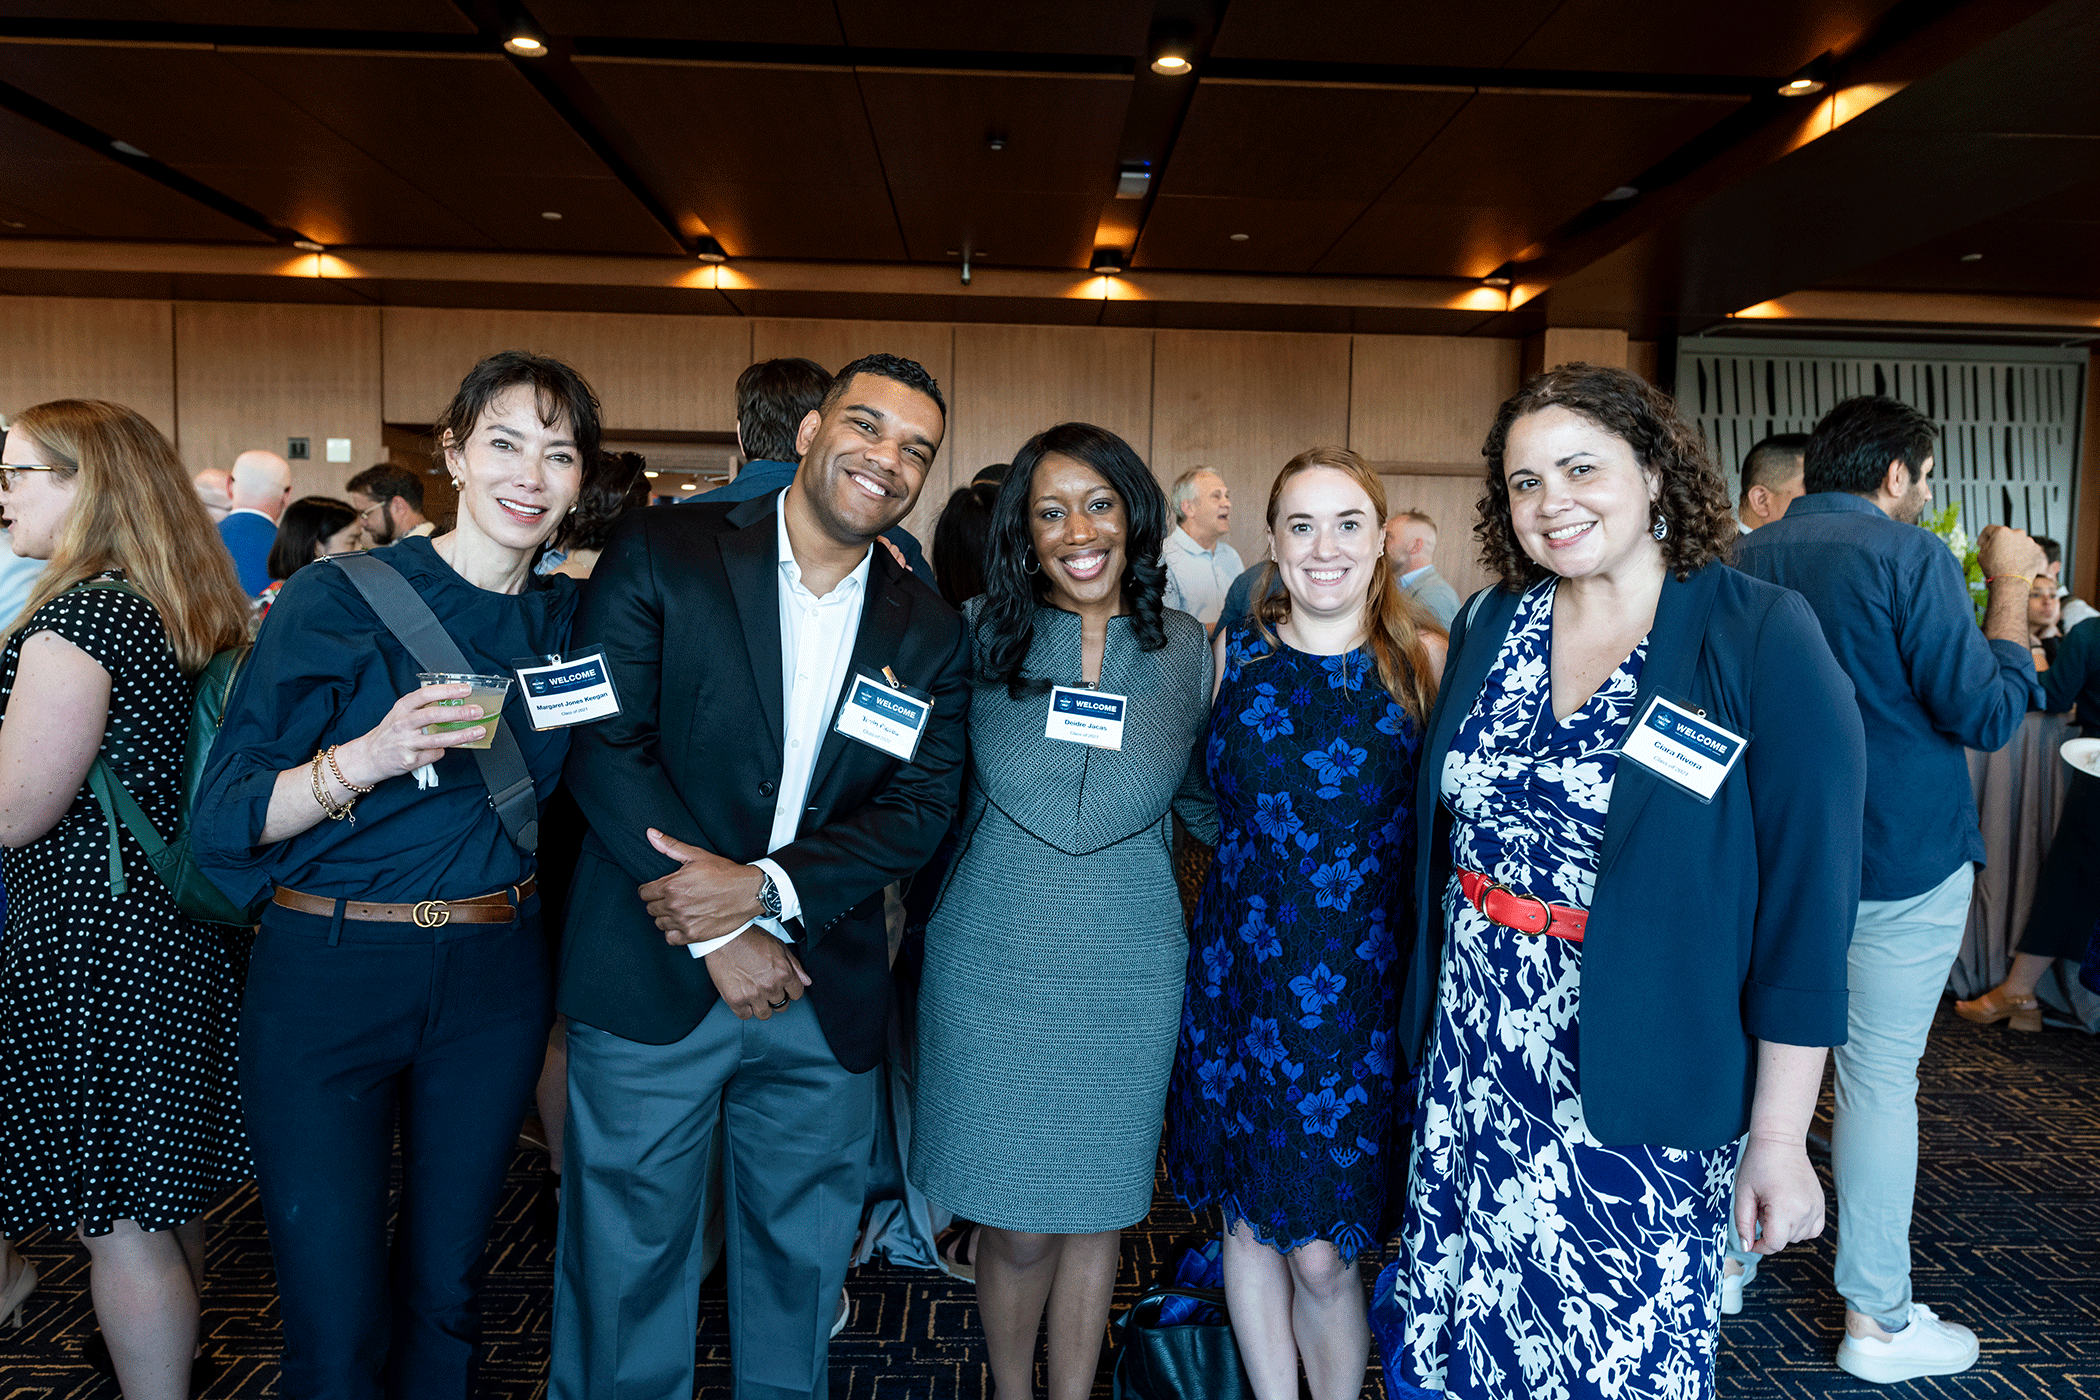
Our top-ranked graduate programs provide students a foundation in both theory and practice. With McCourt’s academic curriculum, professional training and hands-on experiential opportunities, you’ll be prepared to thrive in the public, private, multilateral and nonprofit sectors. Regardless of where you hope to end up, you’ll be ready to lead the field and drive positive change.

McCourt Employment Outcomes
The Office of Career Development and Alumni Engagement’s employment outcome survey is carried out following graduation to track the impact, success and employer demand of graduates of McCourt School’s academic programs.
students employed or pursuing further education
within six months of graduation.
Best college for future leaders 2026,
Georgetown University
TIME Magazine
Employer highlights
- World Bank Group
- Deloitte
- US Department of State
- Spotify
- European Union Parliment
- Innovations for Poverty Action
- Capital One
- IBM Research
- Politico
- Brookings Institute
- AARP
- US House of Representatives
- US Senate
- Bipartisan Policy Research Center
Senior Analyst
Public Policy Specialist
Data Scientist
Strategy Consultant
Deputy Director
sample job titles within 6 months of graduating
Outcomes by program
Alumni changemakers
Graduates of the McCourt School excel as leaders, influencing policy implementation at a global level. Meet some of our notable alumni impacting change through government and diplomacy, private sector organizations and non-governmental organization efforts.
Notable alumni impacting global change
- Chiquita W. Brooks-LaSure
- Former Administrator of the Centers for Medicare and Medicaid Services
- Gustav Chiarello
- Assistant Secretary for Financial Resources, U.S. Department of Health & Human Services
- Laura Chinchilla Miranda
- Former president of Costa Rica
- Iván Duque Márquez
- Former president of Columbia
- Trey Hollingsworth
- Former member of US House of Representatives
- Hakeem Jeffries
- House Minority Leader
- Lt. Gen. Matthew W. McFarlane
- Commanding General of I Corps & Joint Base Lewis-McChord, WA
- Kate Marie Brynes
- Former U.S. Ambassador to North Macedonia
- Douglas Pitkin
- Director, U.S. Department of State’s Bureau of Budget & Planning
- Ruwa Romman
- Member of the Georgia House of Representatives
- Marlon Tábora Muñoz
- Former Governor of the Central Bank of Honduras, Ambassador to the United States
- Gabriel Yorio González
- Vice President, IADB; former Deputy Minister of Finance of Mexico
- Amy Bonitatibus
- Chief Corporate Affairs & Communications Officer, PayPal
- Alex Budak
- UC Berkeley faculty member, Co-founder of StartSomeGood, Author of Becoming a Changemaker
- Francis Creighton
- President & CEO, Wine & Spirits Wholesalers of America; former Chief of Staff to Sen. Chris Murphy
- Jason Fichtner
- Executive Director, Retirement Income Institute, Alliance for Lifetime Income
- Michael Flannigan
- Senior Vice President of Government Affairs, Nuclear Energy Institute
- Jamie Gardner
- Head of Business Transformation for Global Affairs, Google
- Nejla Liias
- President & Founder, Global Health Visions / Kinaura Partners
- Joseph Parilla
- Senior Fellow & Director of Applied Research, Brookings Institution
- Kehinde Togun
- Managing Director, Humanity United

“What I really took away from McCourt more than anything is how to identify a population, come up with a hypothesis and test that, and then see if the policy you’re implementing is having tis intended effect. That’s a framework for how I can measure success in helping restaurants. I want to try to have as big of an impact as possible.”
We train future leaders to design, analyze and put effective policies into practice in the public, private and nonprofit sectors.
Request more graduate program information
Take your next step toward driving impactful change in public policy at the McCourt School of Public Policy.
Complete this form and select the program you’re interested in for more information.
Undergraduate students can connect with admissions staff to learn more.